

Summary of 2025 Reserves
Reserves as of December 31, 2025
| Company Share (GROSS) Reserves | ||||||
|---|---|---|---|---|---|---|
| Description | Light & Medium Oil (MMbbl) |
Tight Crude Oil (MMbbl) |
Conventional Natural Gas (Bcf) |
Shale Gas (Bcf) |
Natural Gas Liquids (MMbbl) |
Total (MMboe) |
| Proved developed producing Proved developed non-producing Proved undeveloped |
253 3 108 |
43 4 83 |
368 12 164 |
1,075 133 1,831 |
148 16 208 |
685 47 732 |
| Total Proved Probable |
365 141 |
130 85 |
544 228 |
3,039 1,834 |
372 191 |
1,464 761 |
| Total Proved plus Probable | 506 | 215 | 772 | 4,873 | 563 | 2,225 |
Net Present Values
Summary of Before Tax Net Present Values OF FUTURE NET REVENUE (Forecast Pricing)
As at December 31, 2025
|
|
Before Tax Net Present Value ($MM) (1) Discount Rate | ||||
|---|---|---|---|---|---|
| Description | 0% | 5% | 10% | 15% | 20% |
| Proved developed producing Proved developed non-producing Proved Undeveloped |
12,281 984 10,331 |
11,028 770 6,687 |
9,443 631 4,439 |
8,249 533 2,973 |
7,361 460 1,973 |
| Total proved Probable |
23,597 18,093 |
18,484 10,714 |
14,513 7,167 |
11,755 5,185 |
9,794 3,964 |
| Total proved plus probable | 41,690 | 29,199 | 21,679 | 16,940 | 13,758 |
(1) Includes abandonment and reclamation costs as defined in NI 51-101 for all of our facilities, pipelines and wells including those without reserves assigned. Abandonment and reclamation costs associated with facilities, pipelines and wells without associated reserves would not be considered material in the determination of the Company's future net revenue.
Profitably Converting PDP Reserves to Cashflow
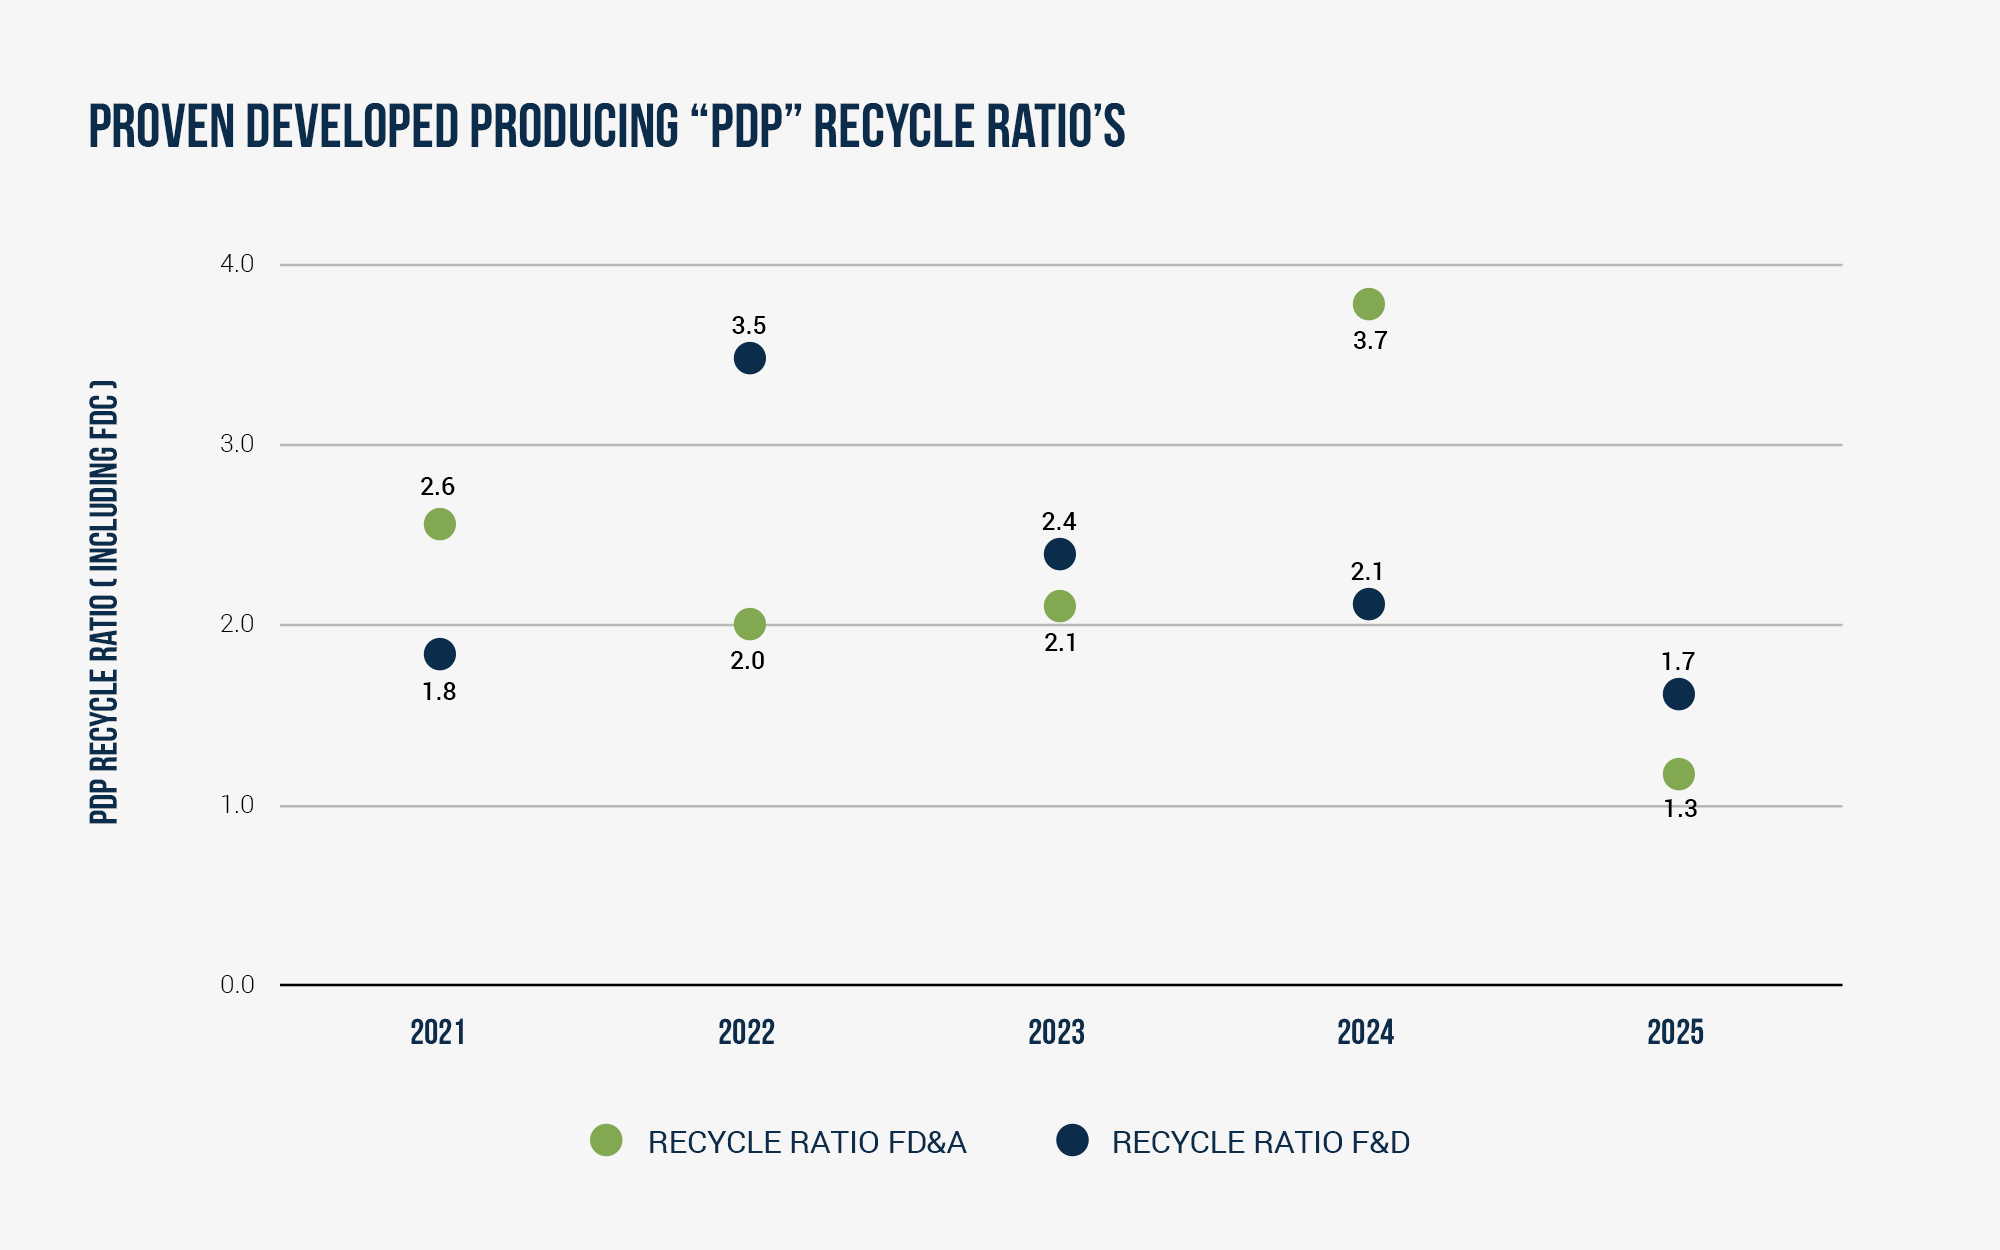
RECYCLE RATIO is a key measure of profitability in the oil and gas industry. The ratio is calculated by dividing the profit per barrel of oil by the cost of finding and developing the barrel of oil. Whitecap focuses on PDP recycle ratio as this reflects whether we are generating sufficient cashflow to replace the barrels we are producing, and therefore can grow economically through internally generated cashflow.
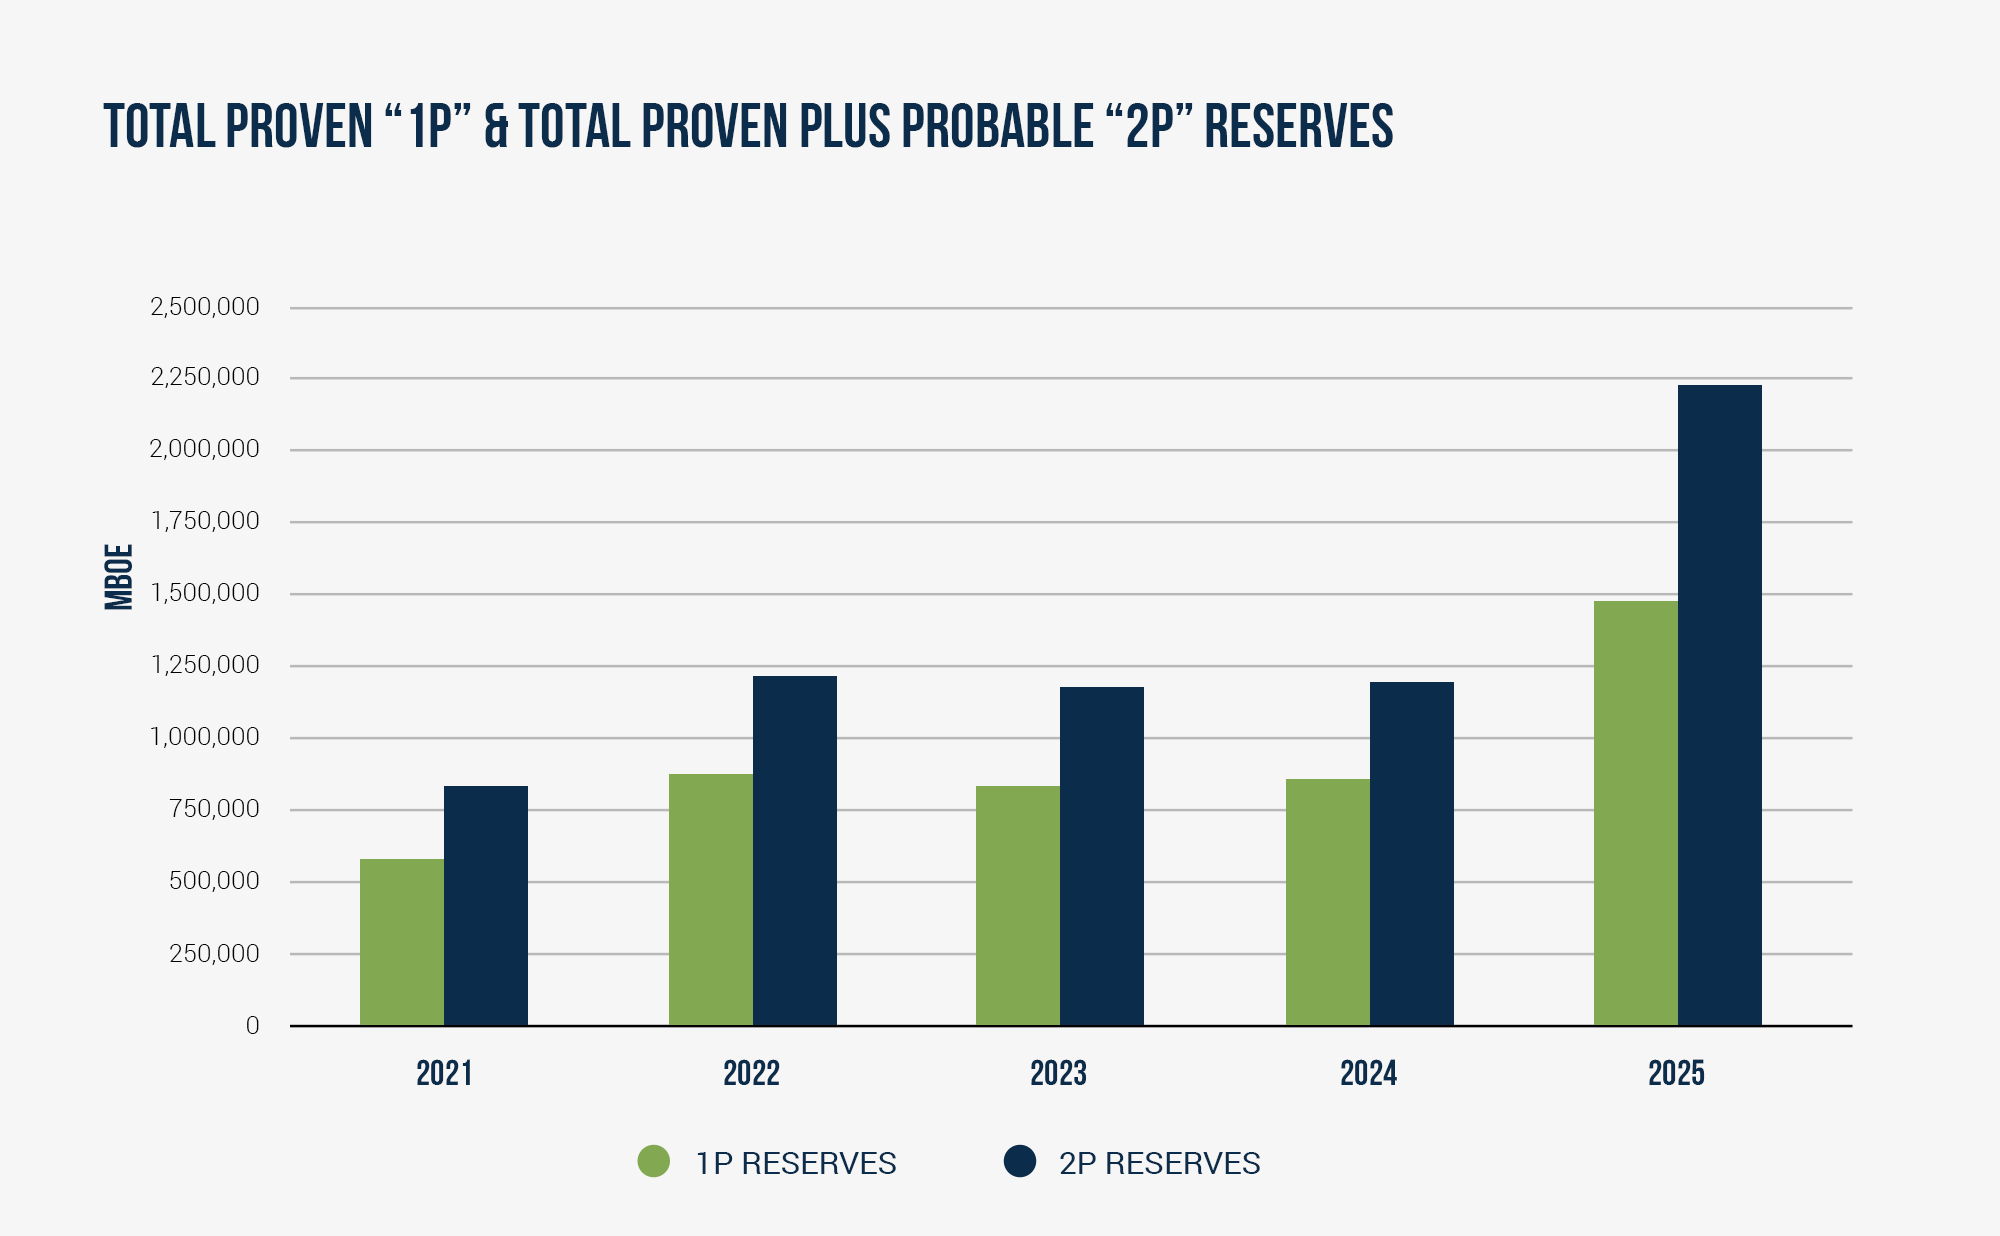
Sustainable Reserves Growth
Click here for full details and disclaimers on our 2025 year end reserves
Headquarters 403-266-0767
- 3800, 525 - 8th Avenue SW
- Eighth Avenue Place, East Tower
- Calgary, Alberta, Canada T2P 1G1
Emergency 1-877-230-3780
- © 2026 Whitecap Resources Inc.
- Privacy / Legal
